

Green city
“We have excellent air quality, green spaces and sustainable transport.” — Imagine Portsmouth 2040
12 µg/m³ background · 19 roadside (µg/m³; legal limit 40)
Roadside nitrogen dioxide at the city's monitored streets. Hilsea urban background monitor.
Source: Defra UK-AIR · NO2, urban background, 2025
Checked 23 September 2026
| Year | Background | Roadside |
|---|---|---|
| 2001 | 27 | — |
| 2005 | 23 | — |
| 2010 | 22 | — |
| 2015 | 19 | — |
| 2018 | 19 | 31 |
| 2019 | 17 | 28 |
| 2020 | — | 21 |
| 2021 | — | 23 |
| 2022 | 15 | 23 |
| 2023 | 13 | 21 |
| 2024 | 13 | 21 |
| 2025 | 12 | 19 |
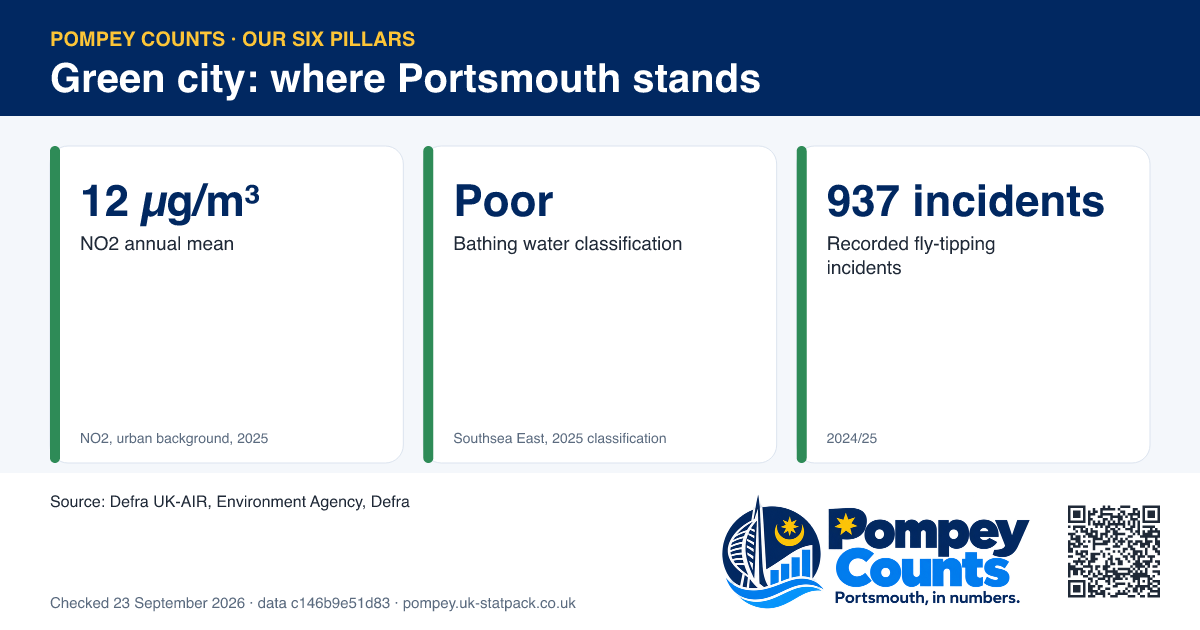
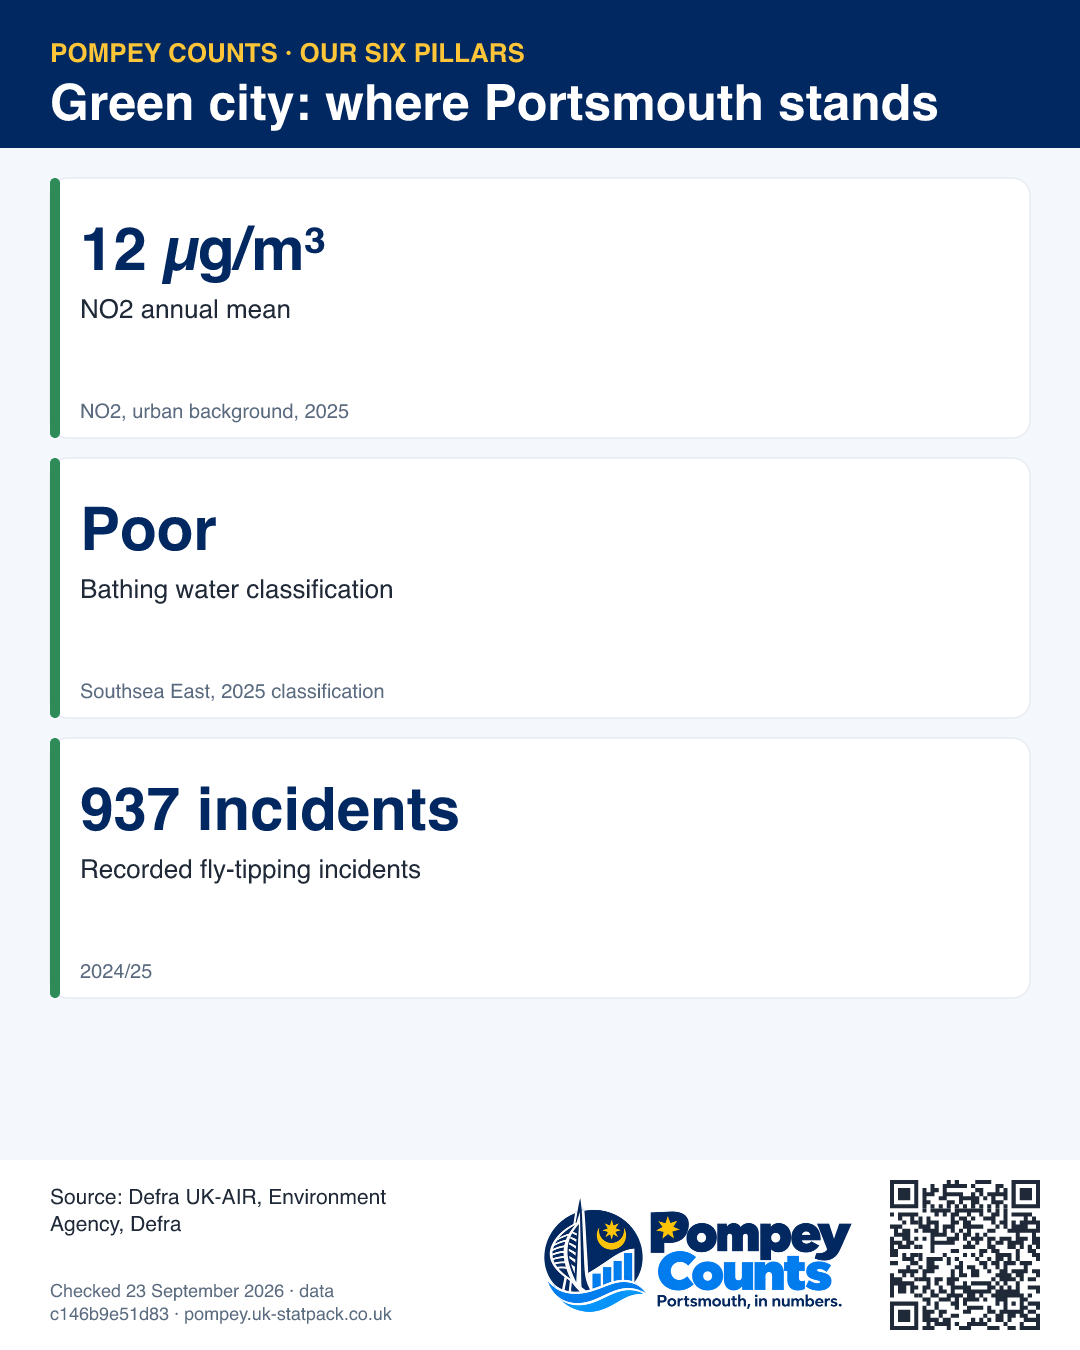
Environment Agency annual rating for Southsea East beach. Southsea East sampling point.
Source: Environment Agency · Southsea East, 2025 classification
Checked 23 September 2026
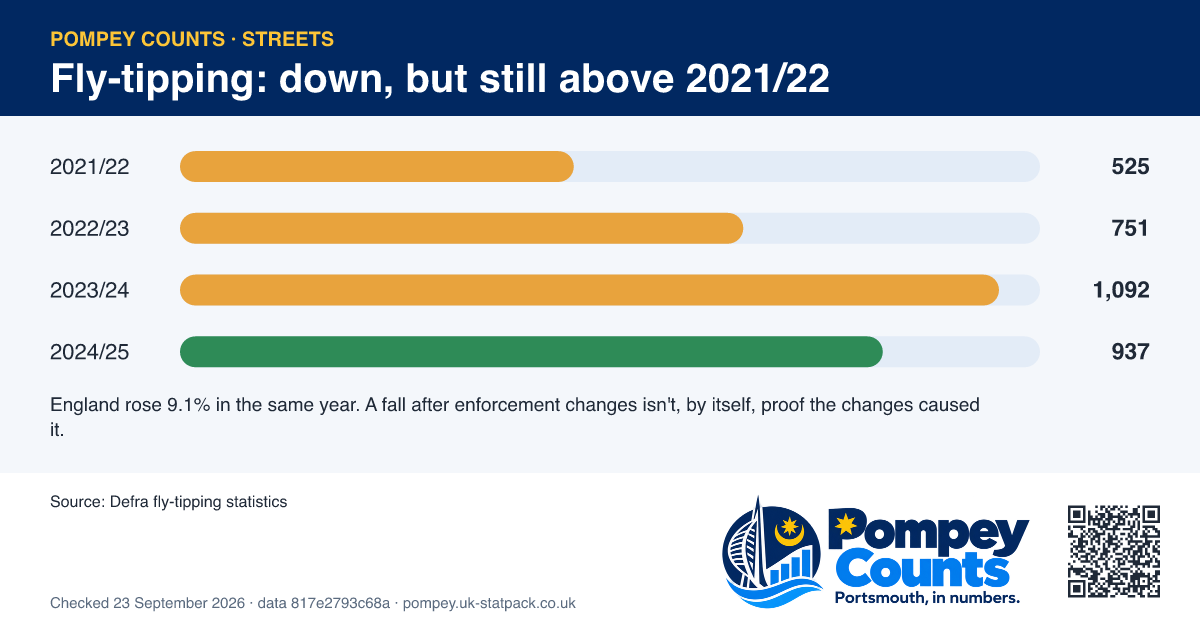
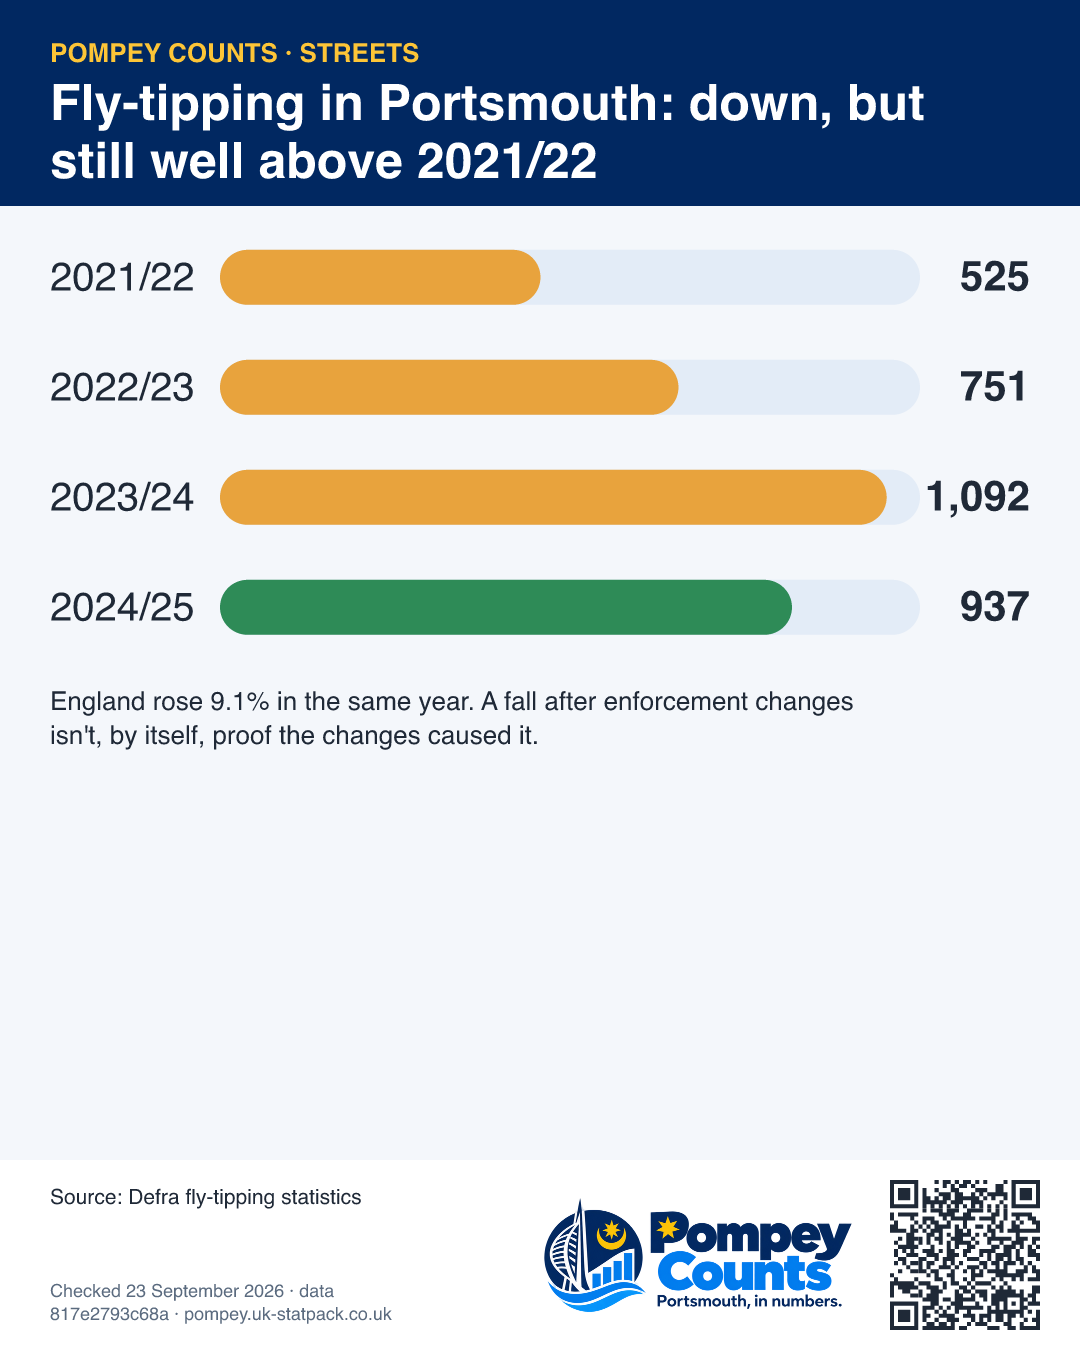
Fly-tipping incidents recorded by the council each year. Portsmouth local authority.
Source: Defra · 2024/25
Checked 23 September 2026
Projects and commitments
Bar shows delivery stage: allocated → funded → underway → complete. Money announced is not money spent.
Council Plan commitments (4)
- ensuring we are resilient to the impacts of climate change, through our multi-million pound transformative sea defence programme (4a)
- continuing to both lobby and work with partners to improve air and water quality and city biodiversity (4b)
- developing solutions to address waste reduction, increasing reuse and recycling and responsible waste disposal (4c)
- reducing carbon emissions in line with our Net Zero commitments (4d)
Linking these to the pillar is UK Stat Pack analysis; the Council Plan does not map them.