

‹ Back to Our six pillars
Easy travel
“We encourage and support more walking and cycling, have excellent public transport connections…” — Imagine Portsmouth 2040
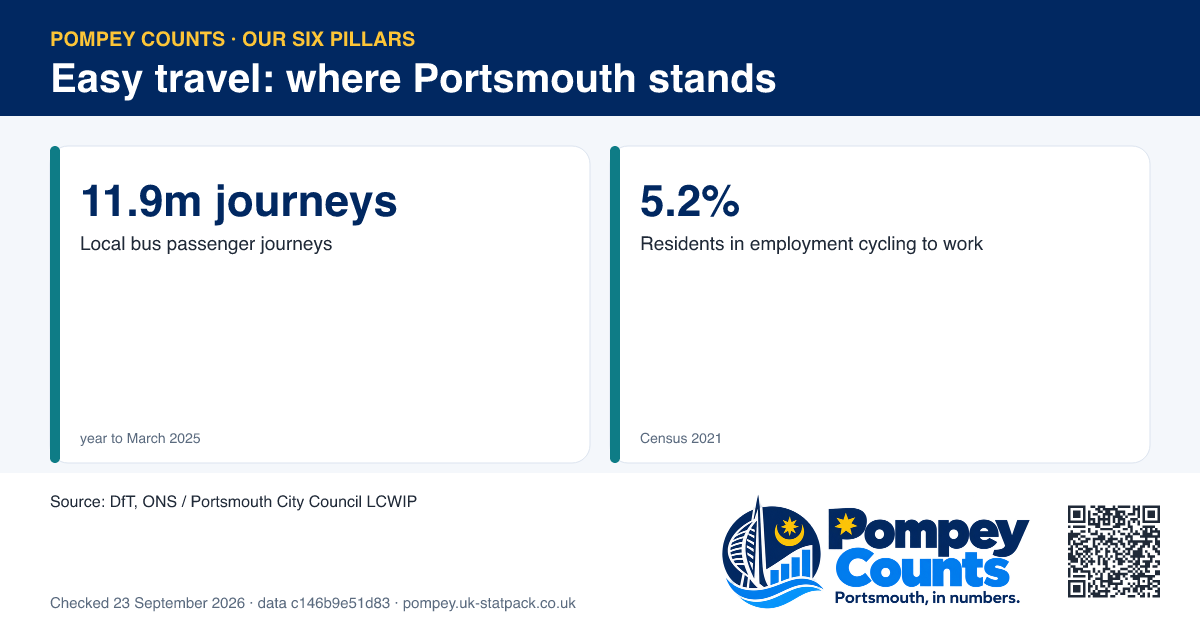
11.9m journeys bus journeys a year
Bus journeys taken across Portsmouth each year. Portsmouth local authority.
Source: DfT · year to March 2025
Checked 23 September 2026
| Year | Journeys (m) | Per head | England per head |
|---|---|---|---|
| 2010 | 10.5 | 52.6 | 88.4 |
| 2014 | 10.3 | 50.1 | 86.7 |
| 2018 | 11.6 | 54.9 | 78.2 |
| 2019 | 11.0 | 52.1 | 77.1 |
| 2020 | 9.9 | 47.0 | 72.5 |
| 2021 | 3.9 | 18.8 | 28.1 |
| 2022 | 7.8 | 37.5 | 50.2 |
| 2023 | 9.4 | 45.0 | 59.3 |
| 2024 | 11.5 | 53.8 | 62.6 |
| 2025 | 11.9 | 55.6 | 62.6 |
Driving a car or van
Work mainly at or from home
On foot
Bus, minibus or coach
Bicycle
Passenger in a car or van
Train
PortsmouthEngland
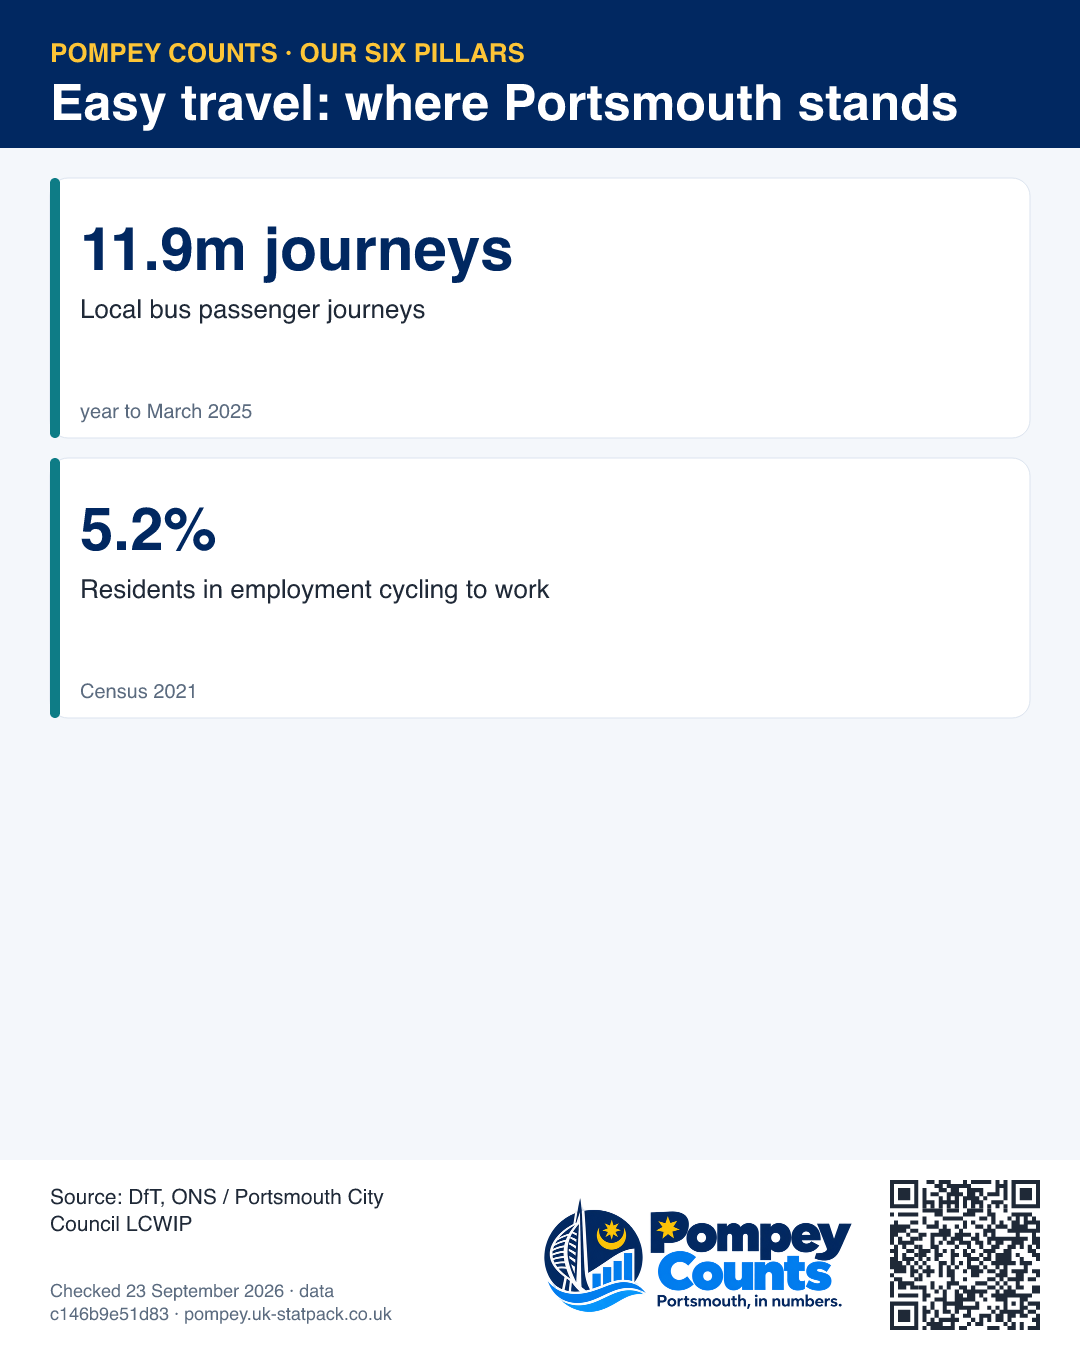
Residents in work who travel by bicycle. Portsmouth local authority.
Source: ONS / Portsmouth City Council LCWIP · Census 2021
Checked 23 September 2026
- City council: local roads, parking and bus services today.
- Regional authority: strategic transport — what it controls.
- Operators: timetables and fares.
Projects and commitments
Bar shows delivery stage: allocated → funded → underway → complete. Money announced is not money spent.
Council Plan commitments (1)
- delivering our ambitions for a people-centred connected travel network (1d)
Linking these to the pillar is UK Stat Pack analysis; the Council Plan does not map them.